Data - Lesson 1: Learning from Data
Overview
In this lesson students explore data from the Google Trends tool in order to tell a "data story" which explains both what the data shows and why that might be. Following this, students are introduced to the concept of metadata and look for the metadata of datasets using Quorum.
Goals
Students will be able to:
- Differentiate between what data shows and why that might be the case
- Use Google Trends to tell a data story
- Explain the usefulness of metadata
Purpose
The three main purposes of this lesson are:
- Navigating and using a data in Quorum from Google Trends
- Getting acquainted with talking and writing about data. In particular we want to:
- Draw a distinction between describing what the data shows and describing why it might be that way
- In other words: describe connections and trends in data separate from drawing conclusions.
- We want students to get in the habit of separating the what from the why when it comes to talking and writing about data
- Introduce the concept of metadata. We want students to understand the value of data about data, that can be used to find, organize, and manage information. It also increases effective use of data by providing extra information.
Resources
Getting Started (5 minutes)
Welcome to Unit 9: Data! In this unit, we are going to learn how to organize and visualize data to answer questions. We'll make charts, look for patterns, and consider the impact that data collection has on our world.
Let's get things started by asking a question.
Discuss: What time of year do people tend to search online for chocolate? How could you check your guess?
Discussion Goal
Student answers will vary, but they may include major holidays like Valentine's Day. Students may also have several different ideas for how those answers could be checked, and ultimately you will want to guide your students towards the idea of using a search tool.
Remarks
- Search tools are useful for efficiently finding information. How can we analyze our searches to discover patterns or trends? Let's find out!
Activity (30 mins)
Remarks
When you post information to a social network, watch a video online, or simply search for information on a search engine, some of that data is collected, and you reveal what topics are currently on your mind. When a topic is quickly growing in popularity, it is often said to be trending, but there are many different trends or patterns we might find in this data, including historical trends. These patterns might help us to identify, understand, and predict how our world is changing.
We will be using Google Trends which is a tool that allows you to visualize data about search history across different times and locations. We can use it to look for interesting patterns, trends, or relationships between multiple trends and try to tell the story that pattern is showing. Google Trends itself is not very accessible, so we have included data as part of a project and new data can be downloaded from trends as Comma Separated Values files (CSV), which can be loaded throughout this unit.
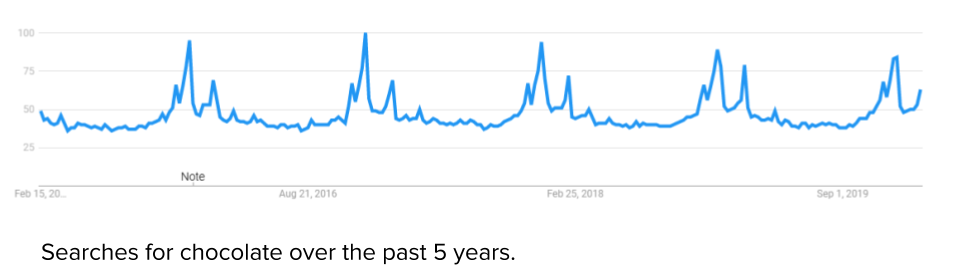
Display: The chart relates to the warm-up question and shows searches for chocolate over the past 5 years.
Open Accessible Charting, Lesson 1
Open a Project: Have students open the Unit9 project Lesson1_App1.
Activity: This project opens an accessible chart of the chocolate data for the last five years. It provides an accessible and explorable alternative of the data.
This chart gives us information: a collection of facts and patterns extracted from data. We can use this information to identify trends, make connections and address problems.
There are two distinctions we need to make when looking at a chart or visualization:
- What does the data tell us about the relationships between variables?
- Why might that be the case?
The 'what' is the facts of the matter. Chocolate searches spike in December. The 'why' is an informed opinion. Chocolate searches spike around the time of the winter holidays because it's a common gift.
Do This: Demonstrate how to use Google Trends or the accessible charting project in front of the class. Google Trends also has the capability to change search terms. Download, or share in the class, a CSV file and load it into the accessible charting program by changing the code.
Do This: Now students use charting to look for 'data stories'. Depending on class time, allow students to share their data stories with partners or with the class as a whole.
Remarks
Using Data from Google Trends to find patterns represents an important concept in understanding how programs are used to gain insight and knowledge from data. When you worked with the tool, there were elements of both interaction and iteration. You interacted with the tool trying out several different options, and repeated the process (iteration) until you came to a possible conclusion.
As you were determining the Why in your data stories, you may have been tempted to draw concrete connections. However, it's important to remember that correlation (similarities, patterns) does not equal causation (this thing caused that thing). There can be any number of reasons why a pattern or interesting data point may appear in a chart - and our job is to make an informed decision while recognizing that there may be multiple factors at play. Usually additional research with several data sets is necessary to understand the exact nature of the relationship between data. Did this one thing cause another thing to happen? Do more people search for chocolate because they want to give it as a gift, or could there perhaps be another reason?
In this unit we will be making charts to help answer questions:
- I think this chart tells me this ...
- Something is more popular than something else
- Something is more important than something else
- Something has become more or less searched over time
- ... but I'm not sure because ...
- I don't know exactly how the data was collected
- This might tell me people searched for green more than red, but it doesn't tell me why they do that or that green is a better color
- We need more data!
When we consider datasets, it's helpful to know as much about those datasets as possible. Where did the data come from? How much data is included? When was it collected?
All of this information is considered metadata which is defined as 'data about data.'
We can have metadata about any digital data. For example, this picture contains metatdata that tells us the when the picture was created, what the resolution is, and how many people have downloaded it. Datasets can also have metadata that explains more about the information in the dataset.
Prompt: What is the metadata for the chart you created?
Discussion Goal
Many sources of data exist beyond google trends. Search sources like data.gov, or other sources, for Comma Separated Values files that can be loaded into Quorum and charted. What kind of data exists and what does metadata tell us about that data?
Now let's explore metadata in Quorum in the datasets you've used in previous units. Where can we find this information? What can it tell us about the data? How can it help us organize the data?
Do This: Change the data in the provided project to other data sets inside the Data folder for Unit 9. Share with a partner any information you can find on the meta data of the data sets.
Wrap up (10 Minutes)
Review: Review takeaways and add the definition of metadata to journal.
Discussion Goal
When studying graphs. consider what are the facts and what is opinion.
- Fact - What does data tell us about the relationships between variables?
- Opinion - Why might this be the case?
Be careful when making assumptions about data:
- Correlation does not equal Causation.
Metadata are data about data:
- It can be changed without impacting the primary data
- Used for finding, organizing, and managing information
- Increases effective use of data by providing extra information
- Allows data to be structured and organized
Journal
Students add the following word and definition to their journal: metadata.
- MetaData: data that is about data.
Assessment: Check for Understanding
For Students
Open a word doc or google doc and copy/paste the following question.
Question
Explain in your own words the process of creating and updating a variable. How does the Counter Pattern with Event work?
Standards Alignment
- CSTA K-12 Computer Science Standards (2017)3A-DA-11, B-DA-05
- CSP2021: DAT-2.A.1, DAT-2.A.2, DAT-2.A.3, DAT-2.A.4, DAT-2.B.1, DAT-2.B.2, DAT-2.B.3, DAT-2.B.4, DAT-2.B.5, DAT-2.D.3, DAT-2.E.1
Next Tutorial
In the next tutorial, we will discuss Code.org Unit 9, which describes explore innovations in everyday life.