Hour 6: Data Science 1: Working with Data
This lesson is to introduce you to data science.
Overview
Computer science is not just a thing you learn, but a practical skill that can be applied to many facets of everyday life. One of those facets is learning about and understanding data. Data is everywhere, including medical studies that teach you about your health, evidence on public policy, data in sports or even how people watch television. In this lesson, you will learn about the budding field of data science and how you can use programming to use and understand data.
Goals
You have the following goals for this lesson:
- Learn about comma-separated value (CSV) files.
- Learn about the internal computer representation of a spreadsheet: the DataFrame.
- Tinker with the actions in DataFrame and explore the operations that can be used.
Warm up
At its core, data science is the art and science of extracting meaningful insights from data. It combines techniques from statistics, computer science, and domain knowledge to make sense of complex datasets. Whether it is analyzing customer behavior, trying to improve people's health, or predicting future trends, data science empowers organizations to better make evidence-based judgments.
As data science’s role in society has grown in importance, how do you think it impacted these fields?
- Healthcare
- Education
- Finance
Vocabulary
You will be learning about the following vocabulary words:
| Term | Definition |
|---|---|
| Data | A collection of values that convey information, discussion, and calculation |
| Data Science | The study of organizing and analyzing data to make informed decisions |
| Tidy Data | A method used to keep data in a consistent format for analysis across researchers. |
| Comma-Separated Value (CSV) File | A text file that uses commas to separate values and new lines to separate records |
Code
You will be using the following new pieces of code:
| Quorum Code | Blocks | Explanation |
|---|---|---|
| use Libraries.Compute.Statistics.DataFrame | use Libraries.Compute.Statistics.DataFrame | A use statement lets you use a type of Object in your program. In this case, you are using the DataFrame object. |
| DataFrame NAME | DataFrame frame | A variable declaration that makes a new DataFrame. Unlike primitive variables, DataFrame variables don’t need the = sign. |
| NAME:Load(FILE_NAME) | frame:Load(“data/Dogs.csv”) | Loads the CSV file from your computer onto Quorum Studio. The file should exist in a path that the system can identify such as within the project folder. |
| NAME:AddSelectedColumn(COLUMN_INDEX) | frame:AddSelectedColumn(3) | Adds a column via index into the DataFrame object |
| NAME:AddSelectedColumnRange(n, n) | frame:AddSelectedColumnRange(3,6) | Adds a range of columns via index into the DataFrame object |
| NAME:ToText() | frame:ToText() | Outputs the entire loaded file into the console |
| NAME:Mean() | frame:Mean() | Calculates the mean of a selected column of a DataFrame |
| NAME:Median() | frame:Median() | Calculates the median of a selected column of a DataFrame |
| NAME:StandardDeviation() | frame:StandardDeviation() | Calculates the Standard Deviation of a selected column of a DataFrame |
| NAME:Variance() | frame:Variance() | Calculates the Variance of a selected column of a DataFrame |
| NAME:Kurtosis() | frame:Kurtosis() | Calculates the Kurtosis of a selected column of a DataFrame |
CSTA Standards
This lesson covers the following standards:
- 3A-DA-10 : Evaluate the tradeoffs in how data elements are organized and where data is stored.
- 3A-DA-12: Create computational models that represent the relationships among different elements of data collected from a phenomenon or process.
Explore
Data science is a budding and relatively young field that takes elements from computer science and statistics as part of its overall foundation. In some sense, data science is like computer science, except with a greater focus on statistics formulas and visualizations. In some sense it is a bit formal, including trying to understand complicated probabilities and equations. In another, most of the time when actually doing data science, the computer manages a great deal of the math for you and the job is more around interpretation of what the data means. As of the time of this writing, there are no unified and agreed upon standards for what data science really is, or what should be taught, although many groups are putting on their thinking caps [1].
While learning about data science is a big and complicated topic, this lesson will give you practice in exploring some of the basics. These include some programming with the concept of a DataFrame, a concept called Tidy Data, and in the next lesson accessible visualizations. Before you can do anything in data science, however, you need to learn to load data.
Loading Data using Comma Separated Value (CSV) files
The term Comma Separated Value (CSV) is literal. While computer science often names things somewhat poorly, in this case the name of the file is what it sounds like: data separated by a comma. You can make these by hand, but it is much easier to use Excel, Google Sheets, Numbers, or any number of other applications to do so.
This is an example of what a CSV might be like:
daniel, seattle, purple, rocky road
brandon, las vegas, blue, vanilla
brianna, san francisco, black, oreo
rebecca, reno, gold, chocolate
kristine, washington dc, lilac, birthday cake
This CSV example has 5 rows and 4 columns, with each entry separated by commas. The contents of this data are arbitrary, however it is important to recognize what a common CSV file may look like. When you think of columns and rows in this context, notice that names like kristine or rebecca are text, not numbers. This fact is important and can be used by any language that supports data science to mean many sorts of things.
Tidy Data
The concept of Tidy Data is used when trying to create consistent formats of data for analysis. Having readable and consistent data is easier for humans to understand and allows computer programs to read and interpret data similarly as well.
Tidy Data typically contains these properties:
- Variables must be in columns.
- Observations must be in rows.
- Individual cells must represent only one value.
Below shows an example of what data would look like in Tidy format:
| y | x1 | x2 | x3 |
|---|---|---|---|
| 1.0 | 4.0 | -8.0 | 23.0 |
| 3.0 | 73.0 | 3.0 | 5.0 |
| 5.0 | 12.0 | 67.0 | 20.0 |
| 67.0 | 4.0 | 2.0 | 2.0 |
| 53.0 | 7.0 | 5.0 | 6.0 |
In this example, y, x1, x2, and x3 are all variables and the first row is a header representing the name of those variables. The remaining rows contain all of the data points for each variable. Each cell contains only one value.
One important point with Tidy is that not all kinds of data can be stored this way in computer science. Sometimes the amount of data is so large that you need specialized approaches to reduce space. For example, storing the social network for all people on earth or storing temperature data at small increments for generations, takes orders of magnitude more space than is typically required for much data science work. The point is that Tidy data is useful, but the rabbit hole can go deep. It is an extremely useful approach and will work for a great deal of projects, but not all.
Data Frames
The key component in loading data with most programming languages is to use what is often called a DataFrame. A DataFrame is a series of rows and columns, like a table or spreadsheet, except stored in the computer's memory in a picky way. DataFrame objects can contain many kinds of things. For example, one column might contain text, another might contain numbers, and another might contain integers. DataFrames can have selections, kind of like selecting a row or column in a spreadsheet, and can do operations on top of that selection.
While you would use them all pretty rarely, here are some examples of the types of data that you can load into a DataFrame by default:
| y | x1 | x2 | x3 |
|---|---|---|---|
| 1.0 | 4.0 | -8.0 | 23.0 |
| 3.0 | 73.0 | 3.0 | 5.0 |
| 5.0 | 12.0 | 67.0 | 20.0 |
| 67.0 | 4.0 | 2.0 | 2.0 |
| 53.0 | 7.0 | 5.0 | 6.0 |
Loading Data and Selecting Columns
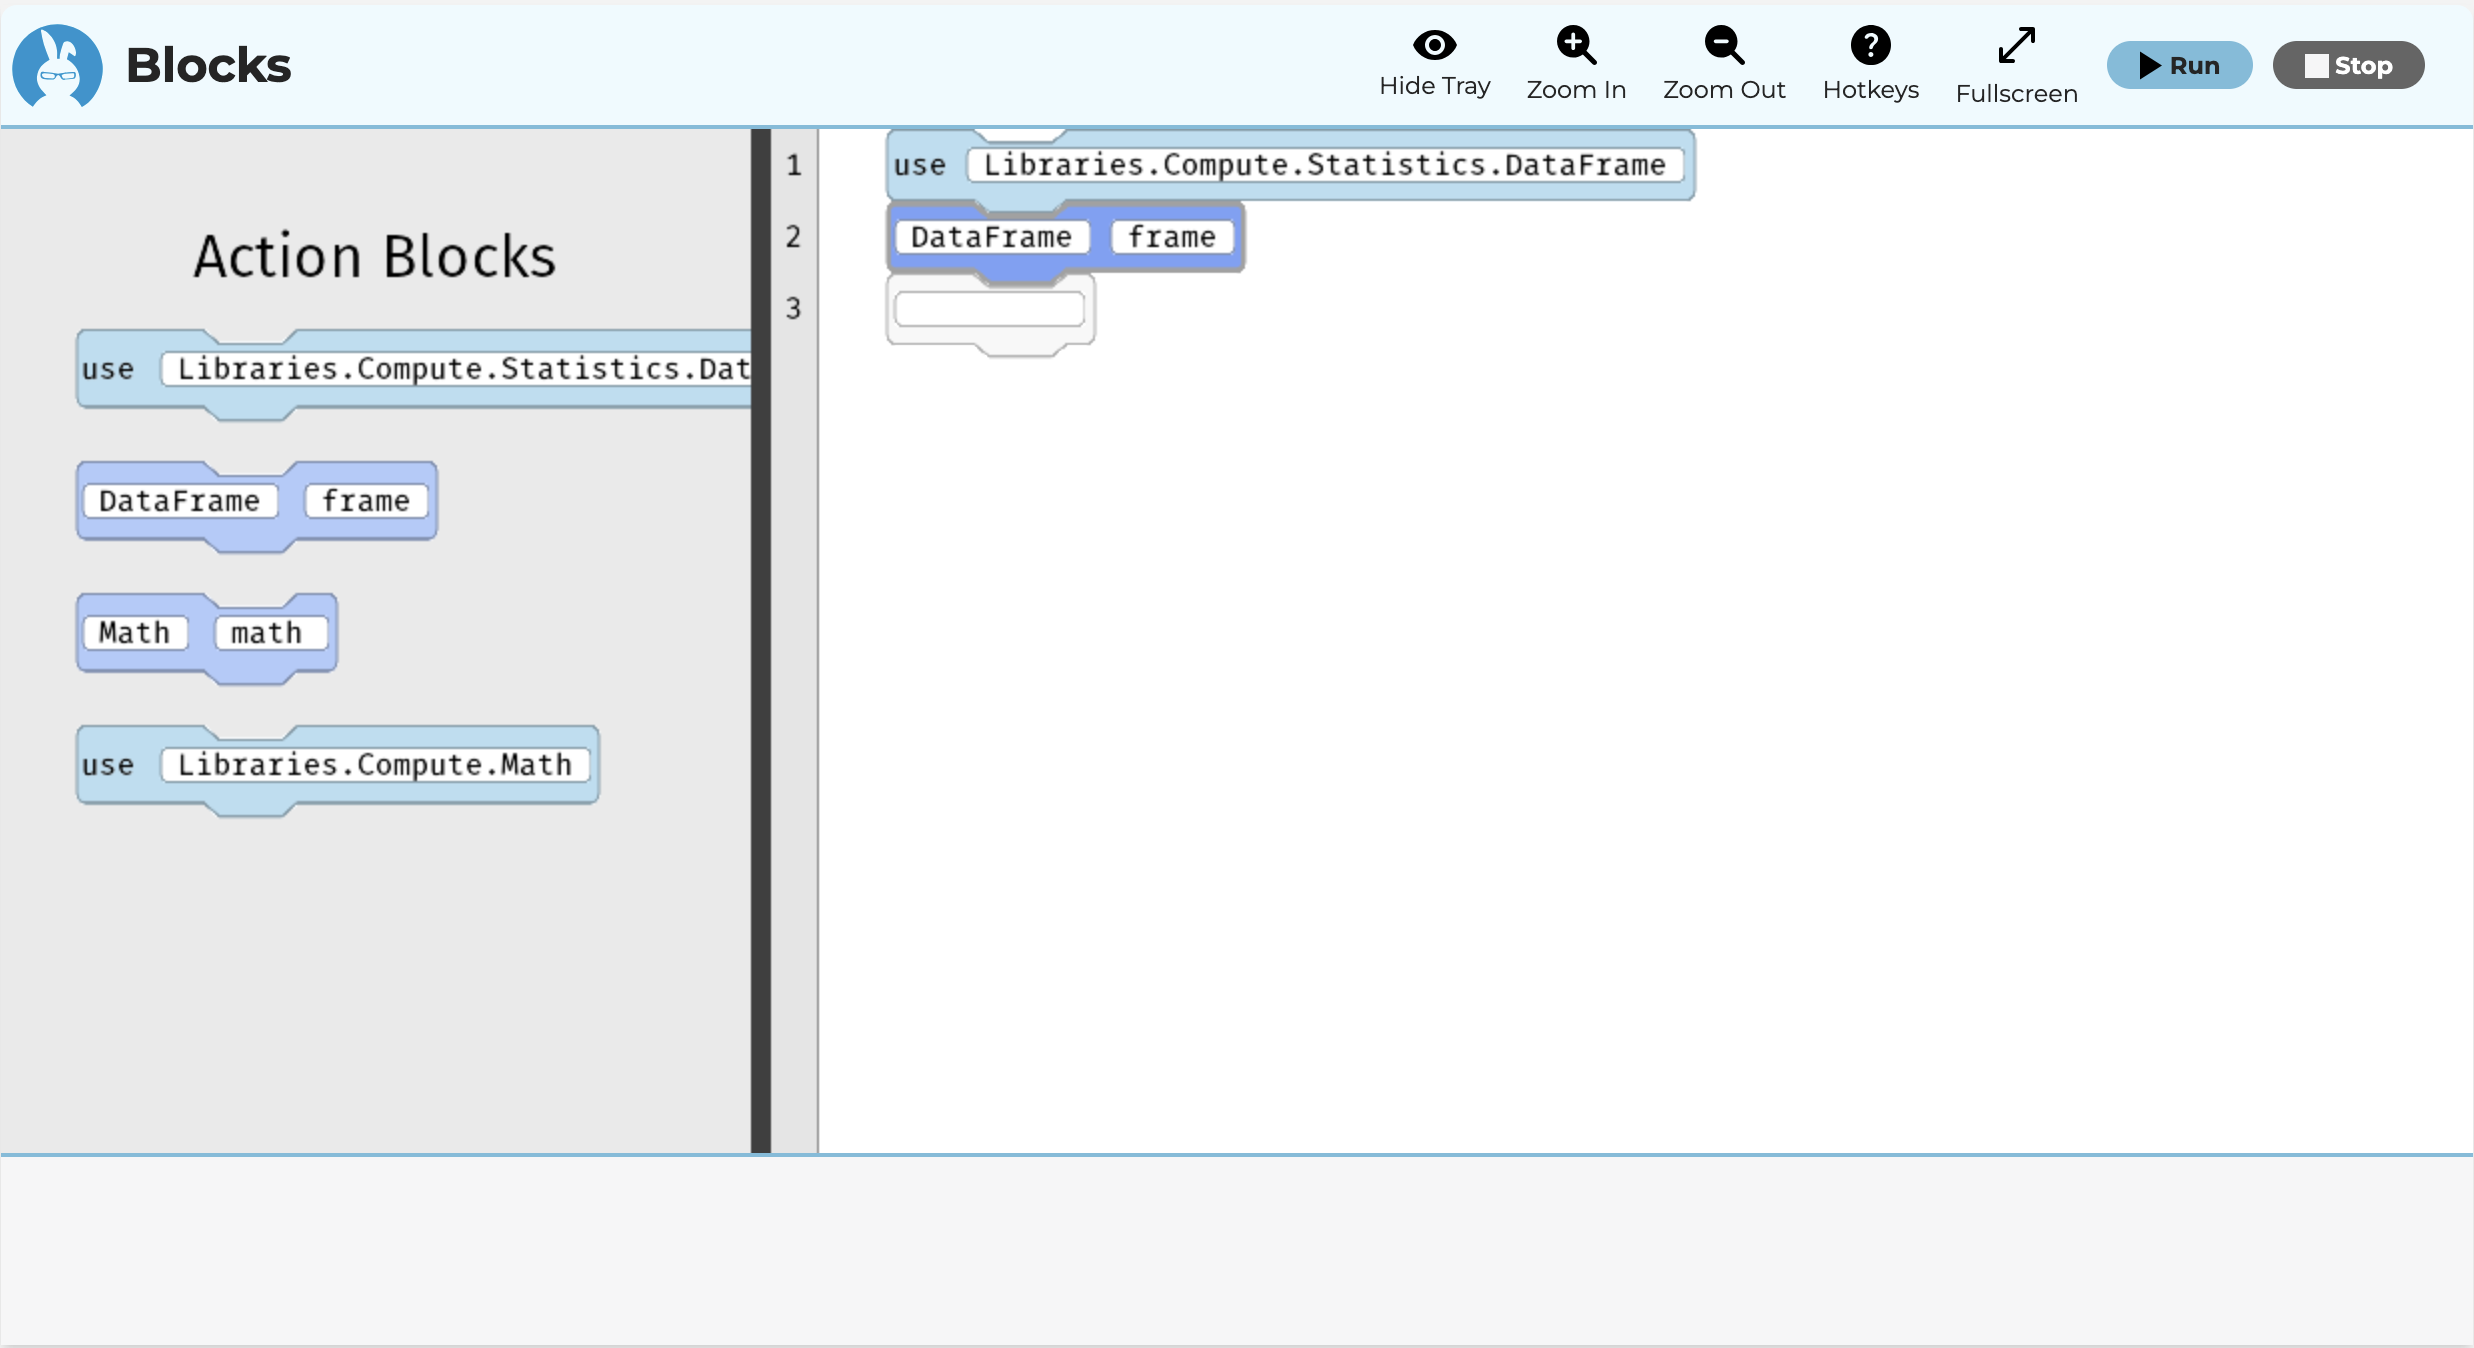
When you want to use a DataFrame, you create a DataFrame object and call load. Here is an example in loading a DataFrame:
use Libraries.Compute.Statistics.DataFrame
DataFrame frame
When using libraries like DataFrame, there is a key difference between offline and online editors. In the offline editor, if you place DataFrame frame, or some other name, into the editor, you can then press ALT+ENTER to have it automatically find the appropriate use statement. You can also right click, or use a keyboard shortcut for your operating system, to pull up the context menu, to have it insert the right line of code.
The online editor has a different purpose and thus works differently. Crucially, the kinds of automatic hints that generate the appropriate use statement are not included in the online editor, so keys like ALT+ENTER would not do anything. This is not an accident. The purpose of the online editor is for learning. Although any valid code can be used in the editor, the tray limits the options to reduce the search space of ideas to think about as you code. Keep in mind that no matter how a use statement is placed in the editor, whether through typing, a hint, or the tray, the result is the same. The use statement gives access to the library that you want.
In the online editor, you may have a variety of files to load from, which are stored on a server automatically for you. In such a case, the files are relative to the root of the server. For example, in the first Parsons problem, the default line given in the editor is:
frame:Load("data/covid19.csv")
In this case, it means that there is a file on the Quorum server that is at the location quorumlanguage.com/data/covid19.csv. The data available on this server is free and for learning, but not extensive.
Select Columns
Once you have loaded data, you can tinker to find how to select columns. Selecting a column is kind of like clicking a column header in a spreadsheet application. It tells the system you want to do some kind of operation on an entire region. The action you want can be found by looking for words like select or column. The actual action you want would be AddSelectedColumn(n) where n is the column index you are adding.
There are two ways to add a selected column to the selection list in DataFrame. One approach is to add it by an index, starting at 0, which is from the left hand side in a spreadsheet. The other is to use its name, which is the value in the first row of the file. As a non-obvious rule, this name may not contain spaces. You may also select a range of columns using AddSelectedColumnRange(n,n) where the n-parameters indicate the column index ranges you are trying to add.
Outputting a DataFrame
Sometimes when using DataFrame objects, you want to get a sense for whether you have loaded it correctly. All DataFrame objects can output themselves to the console for this purpose using an action called ToText(). There are three versions, ToText and two others with parameters related to printing out only pieces of the system.
For example, the following shows the output of 5 rows from Dogs.csv. It is important to note that although you have selected the columns, the action ToText() will output the entire DataFrame. Your selection becomes useful when you are manipulating or transforming data such as adding your data to a chart.
Citations
- Andrea Danyluk, Paul Leidig, Andrew McGettrick, Lillian Cassel, Maureen Doyle, Christian Servin, Karl Schmitt, and Andreas Stefik. 2021. Computing Competencies for Undergraduate Data Science Programs: an ACM Task Force Final Report. In Proceedings of the 52nd ACM Technical Symposium on Computer Science Education (SIGCSE '21). Association for Computing Machinery, New York, NY, USA, 1119-1120. DOI:https://doi.org/10.1145/3408877.3432586
Engage
As is the running theme of these lessons, Parsons problems are a useful mechanism to learning computer science. They isolate small aspects of programming into what are almost mini-lessons. In the Parsons problems, some of them will use the covid19.csv file online to explore the data. In it, you will load in the data, output the data, select columns, and get information from them. To summarize what is in this data, it has the following columns:
- Jurisdiction
- Week of Allocations
- 1st Dose Allocations
- 2nd Dose Allocations
You may use various descriptive statistics for these problems, such as:
| Descriptive Statistic | Plain English Description |
|---|---|
| Mean | The mean is the average of a set of numbers, found by adding them up and dividing by how many there are. |
| Median | The median is the middle number in a set of numbers when they are lined up from smallest to largest. |
| Variance | How spread out the data is from the mean |
| Standard Deviation | The square root of the variance |
| Skew | Roughly, Skew tells us if a set of numbers is lopsided, meaning more values are on one side than the other. |
| Kurtosis | Roughly, Kurtosis shows if a set of numbers has very high or very low peaks |
As a reminder, while even these concepts are quite mathematical in nature, one big benefit of data science is the computer knows how to manage the calculations. If you understand or practice working with what they mean, it can be useful in providing understanding to a human.
Directions
There is one set of Parsons problems for this lesson. In each case, you can drag and drop, use the keyboard, or even just write in the editor the solution to the problem and run the code. As a reminder, the hotkey to run the code is ALT + SHIFT + R on Windows and CTRL + SHIFT + R on Mac.
Parsons Problems
Wrap up
Reflect on what you have worked on in some applications of Data Science. Though you have scratched the surface, in data science you can do far more powerful operations. For example, you can calculate regression formulas, create charts, and many other things. How do you imagine you could use such libraries in your setting? How would these libraries benefit a student wanting to explore career paths in Data Science?
Next Tutorial
In the next tutorial, we will discuss Accessible Visualization Online, which describes how to work with accessible visualization.