Hour 6: Data Science, Part 1 - Working with Data
This lesson will teach you about the basics of working with data in Quorum.Overview
Computer science is not just a thing you learn, but a practical skill that can be applied to many facets of everyday life. One of those facets is learning about and understanding data. Data is everywhere, from medical studies that teach you about your health, evidence on public policy, and even data in sports or how people watch television. In this lesson, you will learn about the budding field of data science and how you can use scaffolded block programming to use and understand data.
Goals
You have the following goals for this lesson:
- Learn about comma-separated value (CSV) files.
- Learn about the internal computer representation of a spreadsheet: the DataFrame.
- Tinker with the actions in DataFrame and explore the operations that can be used.
Warm up
At its core, data science is the art and science of extracting meaningful insights from raw data. It combines techniques from statistics, computer science, and domain knowledge to make sense of complex datasets. Whether it is analyzing customer behavior, optimizing business processes, or predicting future trends, data science empowers organizations to unlock the value hidden within their data.
As data science's role in society has grown in importance, how do you think it has impacted these fields?
- Healthcare
- Education
- Finance
| Term | Definition |
|---|---|
| Data | A collection of values that convey information, discussion, and calculation. |
| Data Science | The study of organizing and analyzing massive amounts of data to make meaningful and data-driven decisions. |
| Tidy Data | A method used to keep data in a consistent format for analysis. The three properties for Tidy Data are: variables must be in columns, observations must be in rows, and individual cells must represent only one value. |
| Comma-Separated Value (CSV) File | A text file that uses commas to separate values and new lines to separate records. |
| Quorum Code | Code Example | Explanation |
|---|---|---|
| use LIBRARY_NAME | use Libraries.Compute.Statistics.DataFrame | A use statement lets you use a type of Object in your program. In this case, you are using the DataFrame object. |
| DataFrame NAME | DataFrame frame | A variable declaration that makes a new DataFrame. Unlike primitive variables, DataFrame variables don't need the "=" sign. |
| NAME:Load(FILE_NAME) | frame:Load("data/Dogs.csv") | Loads the CSV file from your computer onto Quorum Studio. The file should exist in a path that the system can identify such as within the project folder. |
| NAME:AddSelectedColumn(COLUMN_INDEX) | frame:AddSelectedColumn(3) | Adds a column via index into the DataFrame object. |
| NAME:AddSelectedColumnRange(INDEX_1, INDEX_2) | frame:AddSelectedColumnRange(3,6) | Adds a range of columns via index into the DataFrame object. |
| NAME:ToText() | frame:ToText() | Outputs the entire loaded file into the console. |
| NAME:Mean() | frame:Mean() | Calculates the mean of a selected column of a DataFrame. |
| NAME:Median() | frame:Median() | Calculates the median of a selected column of a DataFrame. |
| NAME:StandardDeviation() | frame:StandardDeviation() | Calculates the Standard Deviation of a selected column of a DataFrame. |
| NAME:Variance() | frame:Variance() | Calculates the Variance of a selected column of a DataFrame. |
| NAME:Kurtosis() | frame:Kurtosis() | Calculates the Kurtosis of a selected column of a DataFrame. |
CSTA Standards
This lesson covers the following standards:
- 3A-DA-10: Evaluate the tradeoffs in how data elements are organized and where data is stored.
- 3A-DA-12: Create computational models that represent the relationships among different elements of data collected from a phenomenon or process.
Explore
Data science is a budding and relatively young field that takes elements from computer science and statistics as part of its overall foundation. In some sense, data science is like computer science in the sense that you often program statistics formulas and visualizations. In some sense it is like statistics in the sense that it requires a rather formal and complicated understanding of probabilities and equations to get right. As of the time of this writing, there are no unified and agreed upon standards for what data science really is, or what should be taught, although many groups are putting on their thinking caps.
While learning about data science is a big and complicated topic, this lesson will give you practice in exploring some of the basics. These include some programming with the concept of a DataFrame, a strange concept called Tidy Data, and in the next lesson accessible visualizations. Before you can do anything in data science, however, you need to learn to load data.
Loading Data using Comma Separated Value (CSV) Files
The term Comma Separated Value (CSV) is literal. While computer science often names things somewhat poorly, in this case the name of the file is what it sounds like: data separated by a comma. You can make these by hand, but it is much easier to use Excel, Google Sheets, Numbers, or any number of other applications to do so.
This is an example of what a CSV may look like:
daniel, seattle, purple, rocky road
brandon, las vegas, blue, vanilla
brianna, san francisco, black, oreo
rebecca, reno, gold, chocolate
kristine, washington dc, lilac, birthday cake
This CSV example has 5 rows and 4 columns, with each entry separated by commas. The contents of this data are arbitrary, however it is important to recognize what a common CSV file may look like. When you think of columns and rows in this context, notice that names like "kristine" or "rebecca" are text, not numbers. This fact is important and can be used by any language that supports data science to mean many sorts of things.
Tidy Data
The concept of Tidy Data is used when trying to create consistent formats of data for analysis. Having readable and consistent data is easier for humans to read and allows for computers to run data more efficiently.
Tidy Data typically contains these properties:
- Variables must be in columns.
- Observations must be in rows.
- Individual cells must represent only one value.
Below shows an example of what data would look like in Tidy format:
| y | x1 | x2 | x3 |
|---|---|---|---|
| 1 | 4 | -8 | 23 |
| 3 | 73 | 3 | 5 |
| 5 | 12 | 67 | 20 |
| 67 | 4 | 2 | 2 |
| 53 | 7 | 5 | 6 |
In this example, y, x1, x2, and x3 are all variables and the first row is a header representing the name of those variables. The remaining rows contain all of the data points for each variable. Each cell contains only one value.
Data Frames
The key component in loading data with Quorum Language is to use a DataFrame. A DataFrame is a series of rows and columns, like a table or spreadsheet. DataFrame objects can contain many kinds of things. For example, one column might contain text, another might contain numbers, and another might contain integers. DataFrames can have selections, kind of like selecting a row or column in a spreadsheet, and can do operations on top of that selection.
While you would use them all pretty rarely, here are some examples of the types of data that you can load into a DataFrame by default:
| y | x1 |
|---|---|
| AudioColumn | Loads audio samples, for example from an MP3 file. |
| BigIntegerColumn | Loads really large integers, for values greater than 2,147483,647 or smaller than -2,147,483,648. |
| BooleanColumn | Loads boolean values that are true or false. |
| IntegerColumn | Loads integer values. |
| NumberColumn | Loads number values (integers with a decimal point). |
| TextColumn | Loads raw text as values. |
| VectorColumn | A mathematical optimization for number values used internally for matrix computations. |
Loading Data and Selecting Columns
When you want to use a DataFrame, you create a DataFrame object and call load. As code, this would be the following:
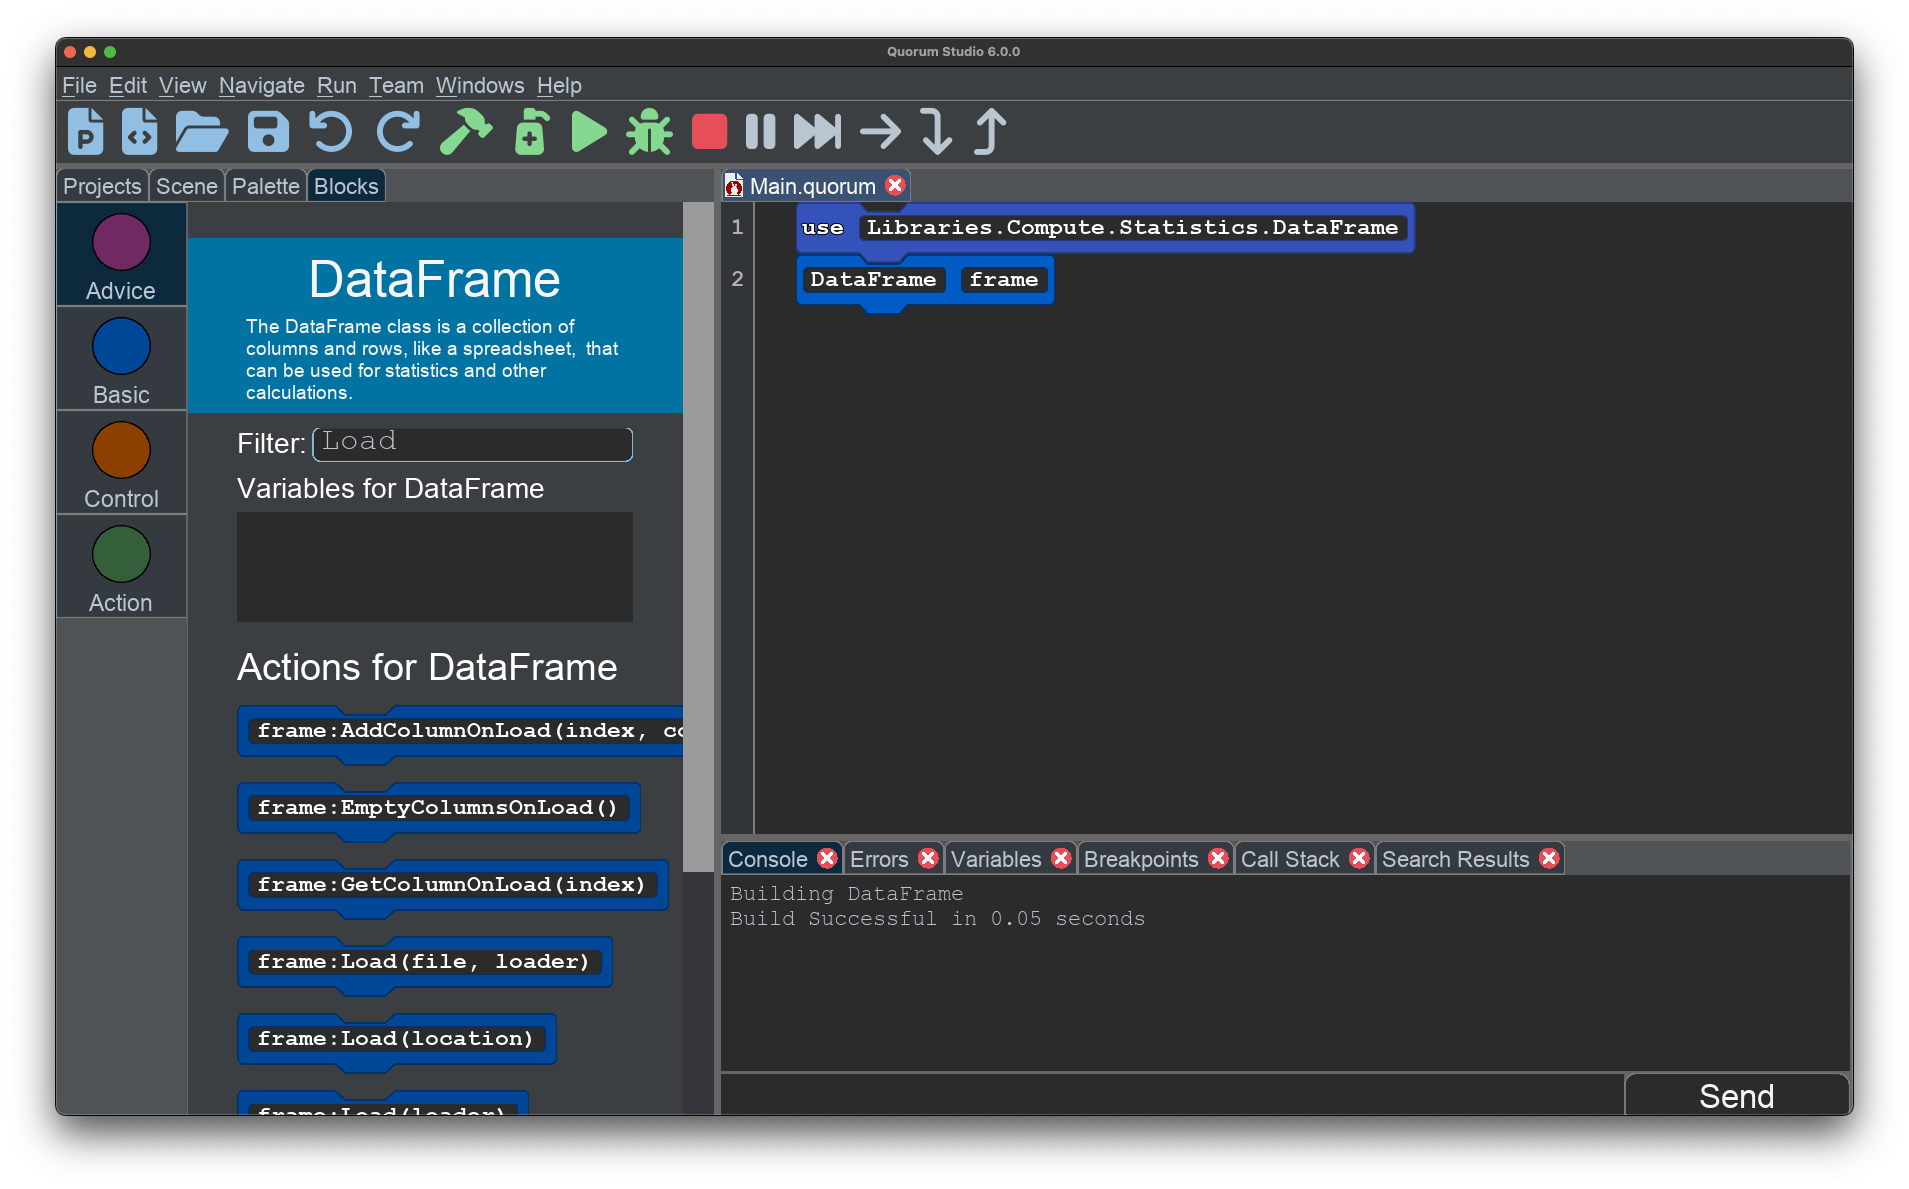
use Libraries.Compute.Statistics.DataFrame
DataFrame frame
If you place DataFrame frame, or some other name, into the editor, you can then press ALT+ENTER to have it automatically find the appropriate use statement. You can also right click, or use a keyboard shortcut for your operating system, to pull up the context menu, to have it insert the right line of code. From there, you can type into the Filter and look for actions that may be related to loading. There are several, but the one you want is frame:Load(location).
When you load this value though, something funny happens: you receive an error. The reason is because the word "location" is a hint to the human from the block, but the computer cannot determine what you likely mean from your current context. The bottom line is the scaffolded block is guessing (and not guessing particularly well in this case). It thinks there is a variable called location, but this was a placeholder the blocks system put in place to provide the human a hint for what to provide.
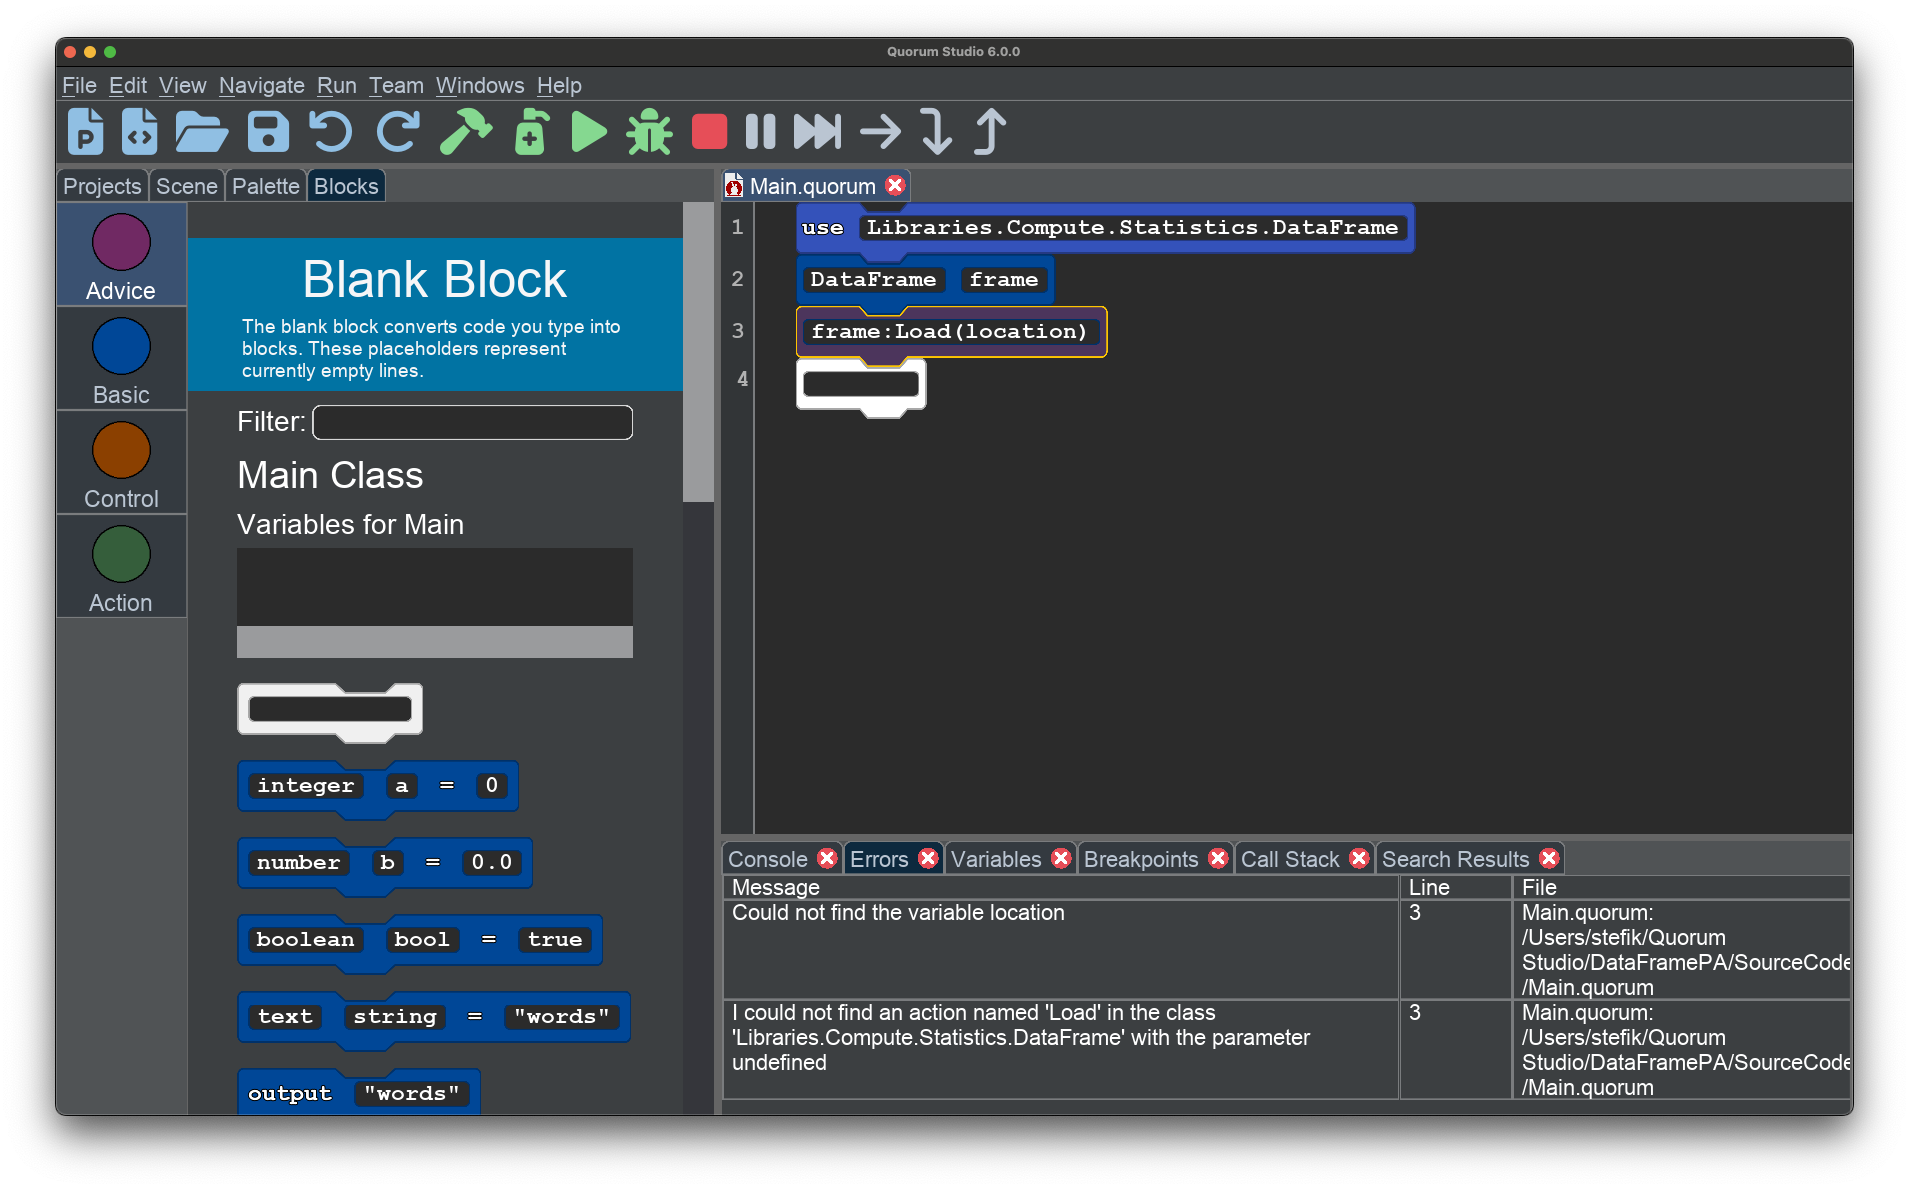
What you should input into this "location" placeholder is typically a file path of the CSV you want to load into the system. A best practice when loading CSV data is to ensure you save the CSV in your project folder to quickly access it in your program.
Select Columns
Once you have loaded data, you can tinker to find how to select columns as well. Selecting a column is kind of like clicking a column header in a spreadsheet application. It tells the system you want to do some kind of operation on an entire region. The action you want can be found by looking for words like select or column. The actual action you want would be AddSelectedColumn(n) where n is the column index you are adding.
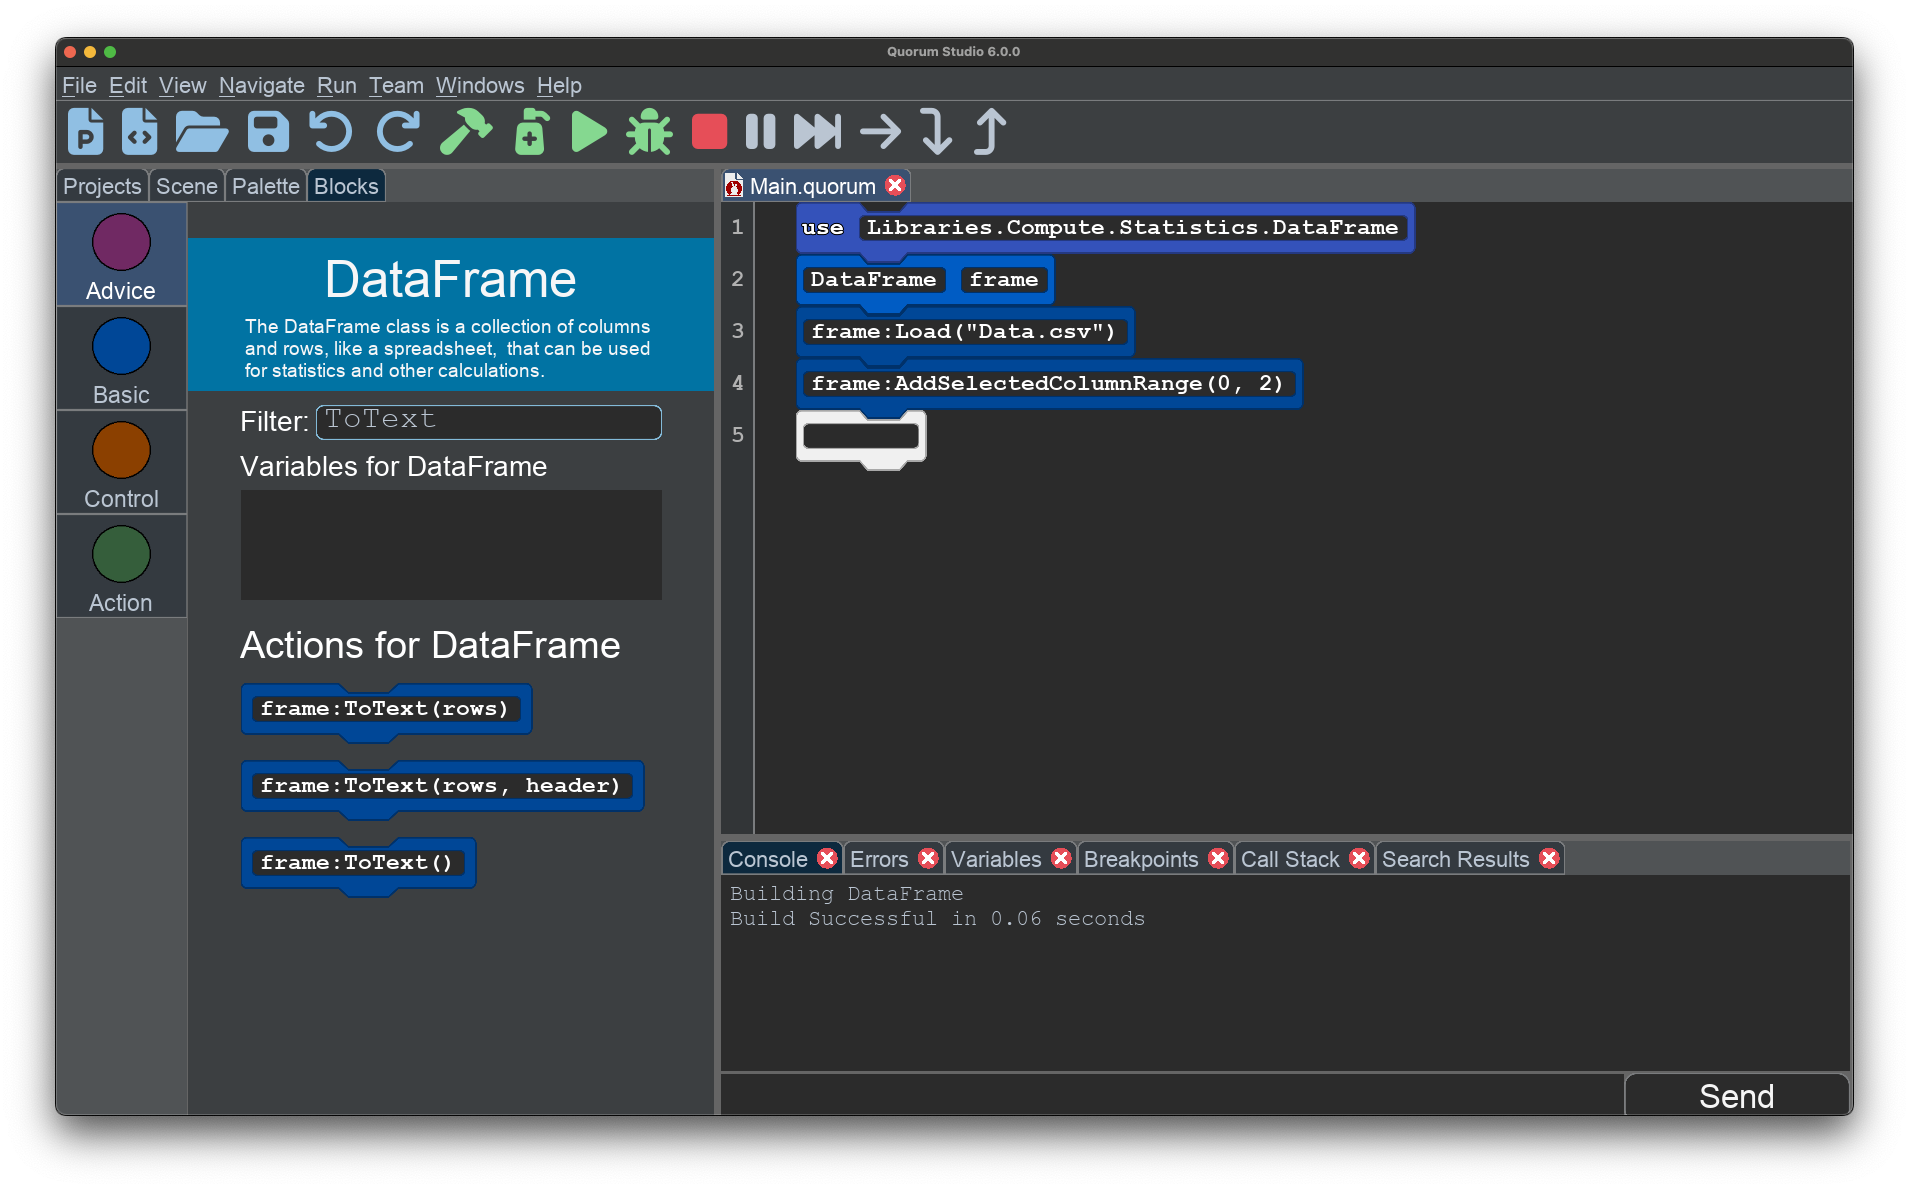
There are two ways to add a selected column to the selection list in DataFrame. One approach is to add it by an index, starting at 0, which is from the left hand side in a spreadsheet. The other is to use its name, like "Dog" or "Cat", as a text value. As a non-obvious rule, this name may not contain spaces. You may also select a range of columns using AddSelectedColumnRange(n1,n2) where the n-parameters indicate the column index ranges you are trying to add.
Outputting a DataFrame
Sometimes when using DataFrame objects, you want to get a sense for whether you have loaded it correctly. All DataFrame objects can output themselves to the console for this purpose using an action called ToText(). There are three versions, ToText and two others with parameters related to printing out only pieces of the system.
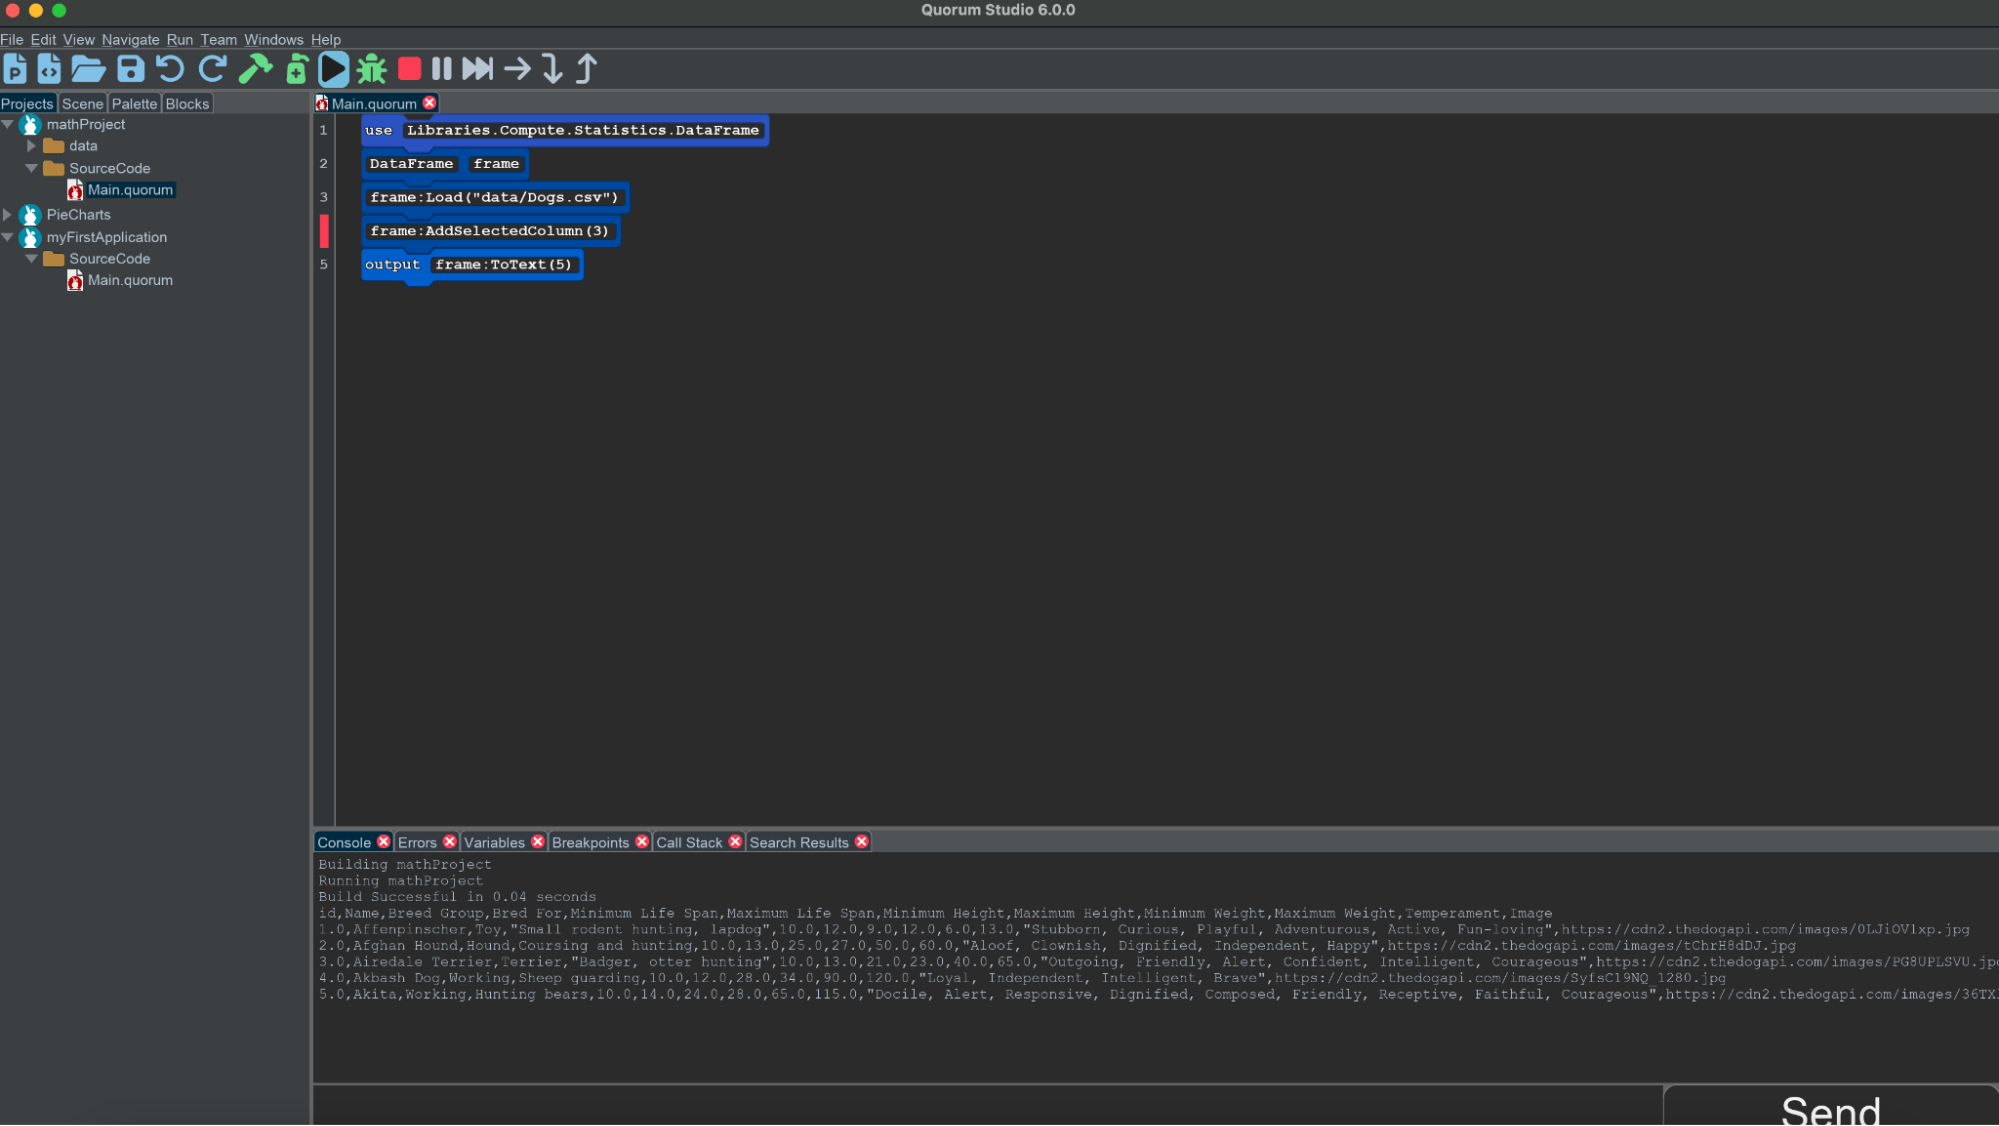
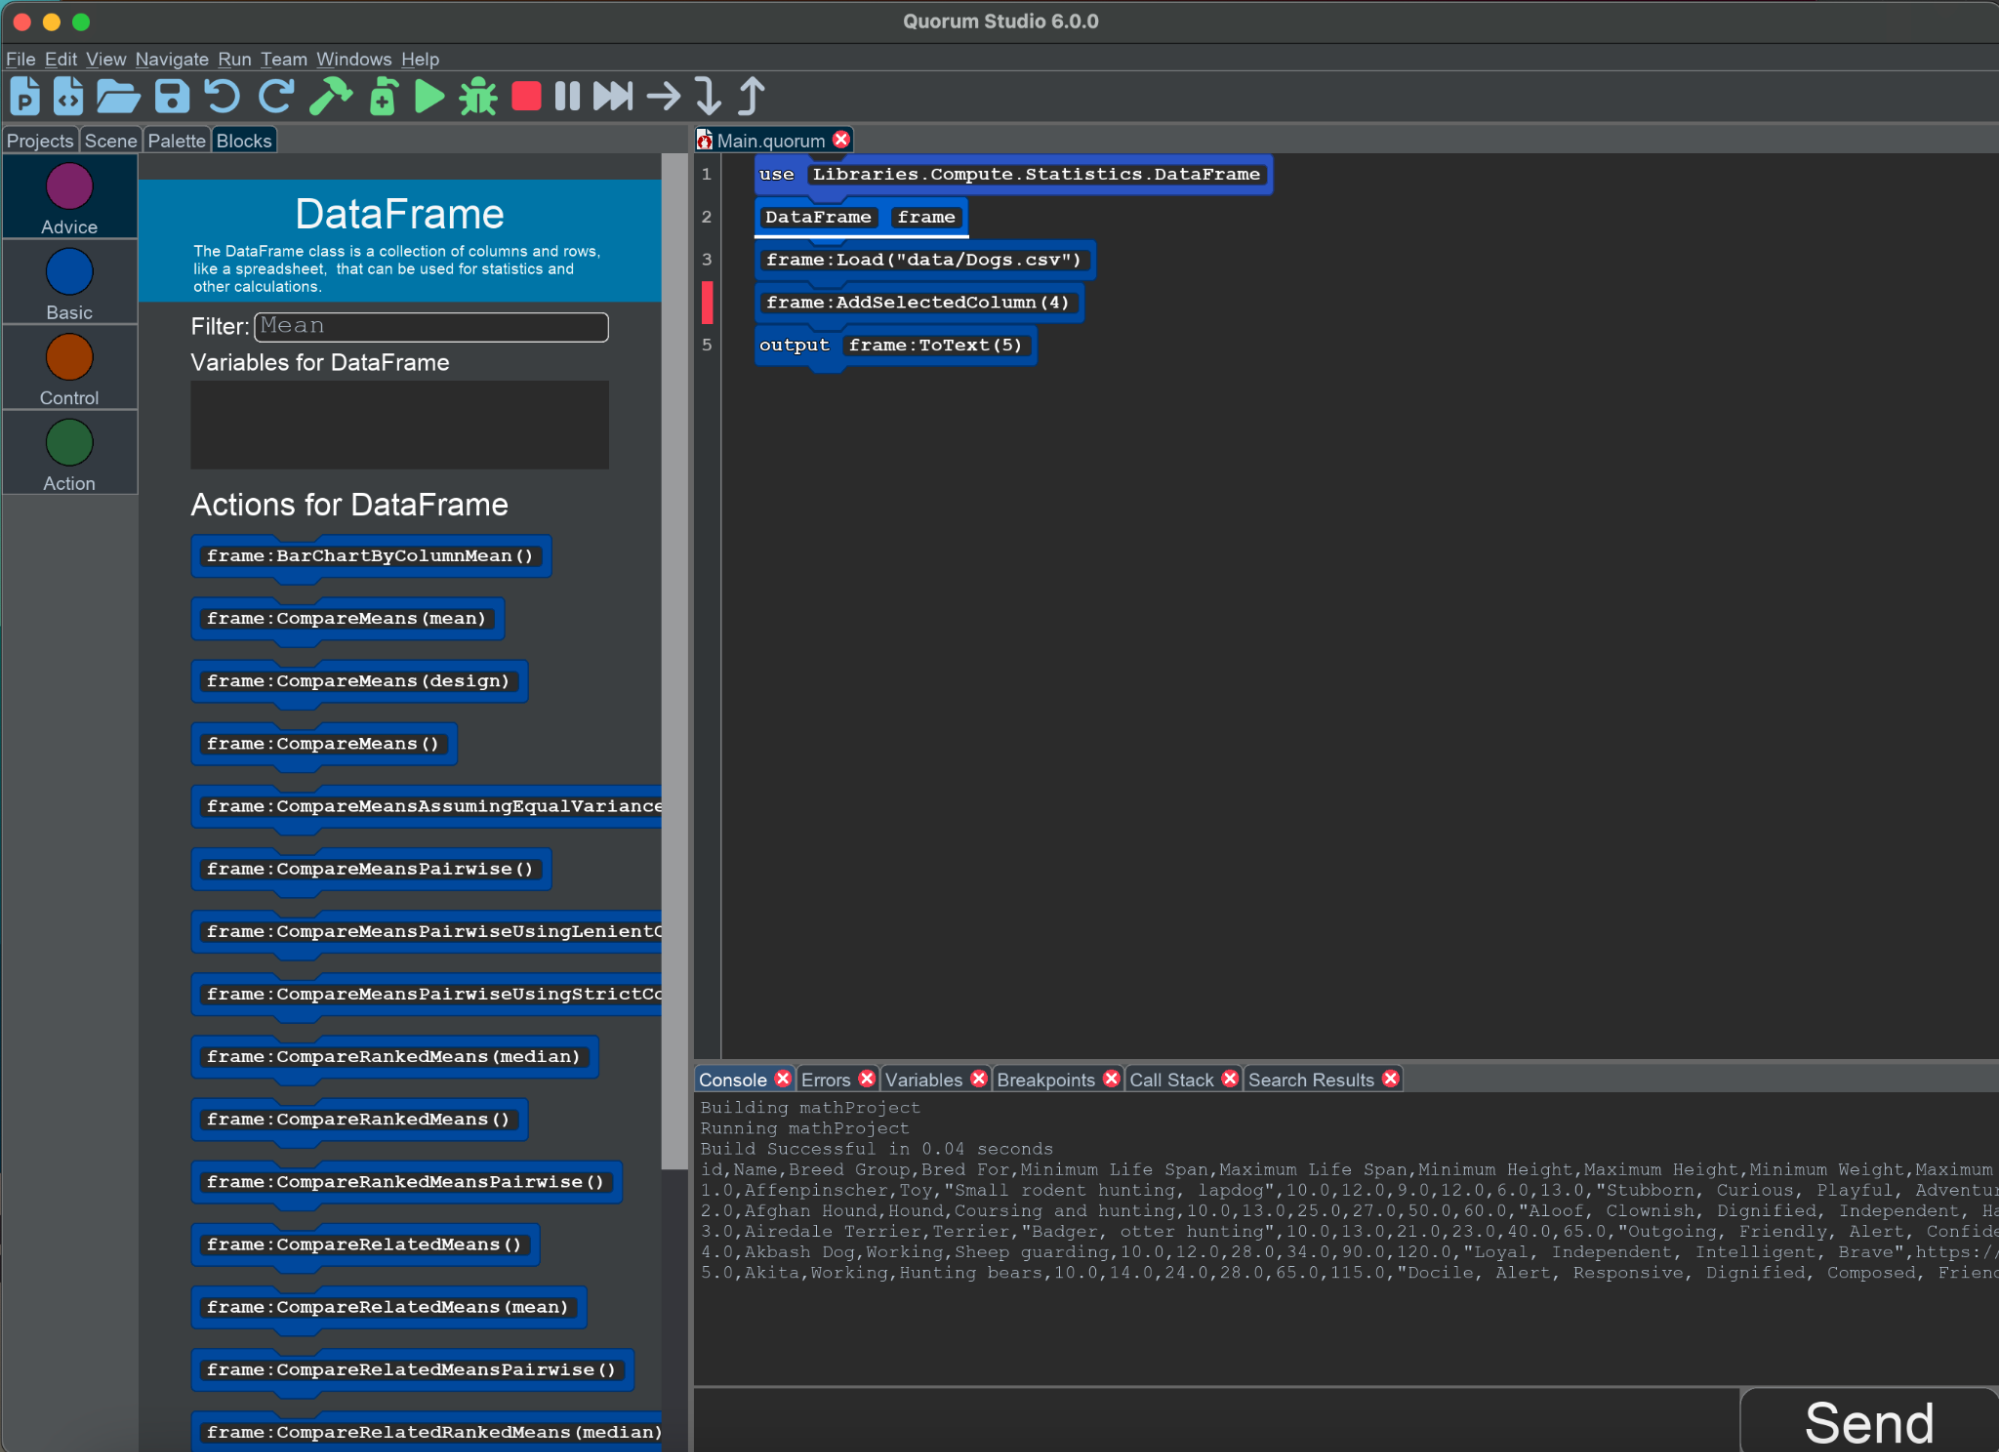
For example, the following shows the output of 5 rows from "Dogs.csv". It is important to note that although you have "selected" the columns, the action ToText() will output the entire DataFrame. Your selection becomes useful when you are manipulating or transforming data such as adding your data to a chart.
Blocks in Disguise
While up until now, you have used only the blocks system for programming, under the hood, you have been programming in text. All blocks, with no exceptions, are automatically translated from text and on disk, all of the code can be examined in raw text. This means that any code used can be copy pasted as text into text editors, used on websites as text (e.g., Stack Overflow, Github) and sent to each other in emails without pasting pictures. It can also be pasted back into the block editor in the same way. In many block languages, there is an academic debate about blocks or text, but in Quorum blocks they are the same thing. When blocks are on, the system uses the exact same code, in exactly the same way, for exactly the same reason. The only difference, for the user, is that if they choose to have them on, they look different and the searchable palette is available. Using them is personal preference.
As an example, the final code for this DataFrame example was copy pasted from the blocks environment and lives as text below:
use Libraries.Compute.Statistics.DataFrame
DataFrame frame
frame:Load("data/Dogs.csv")
frame:AddSelectedColumnRange(0, 2)
frame:ToText(10)
You can copy paste this example back and it would convert itself back to blocks. The number 10, in the final line of code, means to output only the first 10 lines of the DataFrame.
Finding Central Tendencies
Finding operations that can be done in data science is explored through the palette. On the left-hand side where you go to click and drag all the blocks, or use the keyboard to do the same operation, notice that there is a filter search. If you know the name of the operation you want, like mean, it will try to find supported actions. In this case, that is frame:Mean().
Now that you have placed your block, you will probably want to output the calculation. The nifty feature using Quorum blocks is that you are directly able to edit the text on the block therefore when you have your mean action called, you can modify the block to be: output frame:Mean(). You can do the exact same operation in text and under the hood it really is identical. The difference is you do not get the palette in text mode.
Engage
Data science has historically been complex and can be daunting to understand. The language used by statisticians was often designed, written, and implemented by other statisticians that likely could not have predicted data science would exist in the future, let alone that it might be programmed on a seemingly magical box that can do seemingly magical calculations. In this activity, you will participate in statistical calculations, but unlike traditional statistics, you will achieve this through exploring DataFrame actions.
Introduction
The broad idea in statistics is that tests are conducted to try to determine what is true or false. So far, you have selected a column, or a set of columns in a data set. Now you are going to practice extracting and analyzing data. To start, download the National Weekly Pfizer Allocations for COVID-19 dataset.
Load the dataset into the system, then work with the two columns that contain numbers. The CSV file should go in the project folder where you made the project. For consistency, use the name "Data.csv". If you are unsure about the code, you may use the code from the explore section as a guide, and just change which columns are selected.
With your loaded dataset, you will be performing some statistical calculations with the DataFrame object. Here are some of the calculations you can perform by calling actions on the object:
- Mean
- Median
- Standard Deviation
- Variance
- Kurtosis
Use each of these statistical calculations on the dataset provided. Be sure to properly read in your CSV file and select a column to perform your calculations on.
If you want extra practice, try formatting your output to make your results readable using the following format:
Central Tendencies of the following Column: [Column Header]
Mean: [DATA CALCULATION]
Median: [DATA CALCULATION]
Standard Deviation: [DATA CALCULATION]
Variance: [DATA CALCULATION]
Kurtosis: [DATA CALCULATION]
If you have time, calculate the same tendencies with a different column after the first output. For this second calculation, you will need to duplicate your steps and create an additional DataFrame object and repeat the load, or else you will encounter an error. However, this method seems a little inefficient. See if you can look through the available actions inside of the blocks tab to "empty" your DataFrame.
When you properly completed the calculations, double check your answers with the output below:
Central Tendencies of the following Column: 1st Dose Allocations
Mean: 62061.63265306125
Median: 38025.0
Standard Deviation: 81206.03894539685
Variance: 6.59442076120131E9
Kurtosis: 14.60309669876606

Central Tendencies of the following Column: 2nd Dose Allocations
Mean: 61923.45238095237
Median: 38025.0
Standard Deviation: 81217.91840322685
Variance: 6.596350269753216E9
Kurtosis: 14.611164710632751
Wrap up
Reflect on what you have worked on in some applications of Data Science. Though you have scratched the surface, the operations have many more operations available. For example, you can calculate regression formulas, create charts, and many other things. How do you imagine you could use such libraries in your setting? How would these libraries benefit a student wanting to explore career paths in Data Science?
Next Tutorial
In the next tutorial, we will discuss Data Science Part 2, which describes how to create a bar chart in Quorum using the DataFrame.